
Introduction
I embarked on this project as part of a module called Social Analytics and Applications. We were required to look for a client who may have a social business problem that we can look into. We decided to work with Restroom Association to identify social trends and insights from Social Media with regards to public toilet in Singapore. As this was a team project, each of us has individual roles and took on the role of a “architect’ and ‘integrator’ to plan and develop the pipeline for implementing a potential Web App solution. I also developed the prototype for Web Soltution. This project was accepted as a poster at IEEE Big Data 2019 Conference under the guidance of Prof Kyong Jin Shim.
Our Client
Restroom Association is a non-profit organization which advocates clean public toilets in Singapore. They conduct yearly reviews/assesment for public toilets in various location and provide a rating ranging from 1-6 stars. A 6-star toilet means that the toilet is not only clean but have facilities which are user and environmentally friendly. After speaking to your client, we found that one of their difficulty was that there were limited volunteers and it is difficult for them to ensure toilets are clean between periods of assesment. This gave us the motivation to identify ways to provide them with timely updates and informations about various public toilets in Singapore. They also kindly provided us with a Evaluation Sheet which indicated criterias which they used to review each public toilets.
Data Analysis
As this is a analytics module, we were expected to collect data from different sources and gather insights related to social elements of public toilet. The next few sections discussed the process we took to gather insights as well as the insights gathered.
Data Collection
The team collected data from sources such as Reddit, Twitter, Instagram and TripAdvisor using Web Scrapping techniques and various APIS available.

Data Cleaning
As the data were collected from various Social Media source, there was a need to clean the data as there were some post that were captured which were not toilet related. We did some filtering by looking for keywords in the various post such as “urinal,cubicle,toilet,dirty,flush,poop,shit”. Post without any of the relevant toilet keywords were ommitted for further analysis.
Data Preparation
Since the data was largely unstructured, we needed to prepare the data to ensure that analysis and visualization can be done in a systematic manner.
Geotagging
The key in bringing social value to the data collected from various sources was to tie the sentiments or comments to a specific toilet. This will be helpful to Restroom Association in identifying toilets which probably need “surprise” inspection. This requires us to employ several methods to pinpoint or estimate a potential location for any sentiment.
Tagged Location
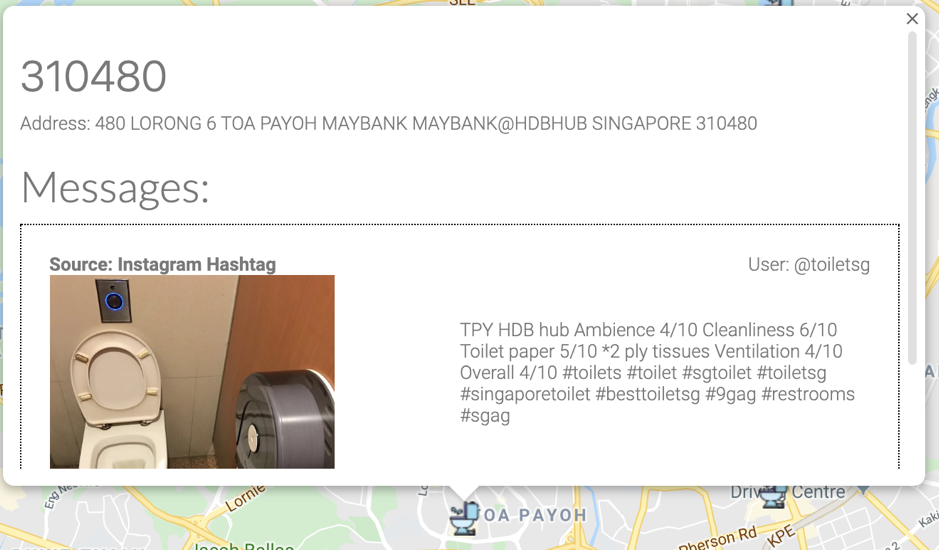
Social Media such as Instagram has a higher likelihood of locations being tagged. In such instances, we do not need to do much further processing and just make use of the data we acquired through scraping Instagram posts.
Although twitter allows location to be tagged, most Singaporeans do not use this feature. Reddit also do not have a feature which allows location to be tagged and therefore other methods have to be employed to retrieve any potential location.
Natural Language Processing
As mentioned previously some social media do not have geotagging feature. However, many of these posts do mention the name of a various places around Singapore. Therefore we attempt to identify various potential location through extracting places in the posts.
From each post, we performed Tokenization and Lemmatization. We then try to identify locations by referencing a txt file which has street names and registerd happy toilet locations in Singapore. Sentimental analysis is also run on each post to determine if the post is positive, neutral or negative.
Geocoding
The various locations identified were then geocoded by querying the landmarks in OneMap API to pinpoint a exact location for each individual post.
Visualization & Analysis
Several forms of visualizations and analysis were used to help us identify potential insights from the data that were collected from the various social media platform.
Word Map
Word Maps were generated from post retrieved by the various social media. These words helped to generate not only insights but also help to expand the reach for our data collection process as well.
One example of how the Word Map helped us expand our data collection was when we first created a wordmap from the captions of initial search of “@the_ultimate_toilet_rater” on Instagram after a simple research about toilet reviewers in Singapore:
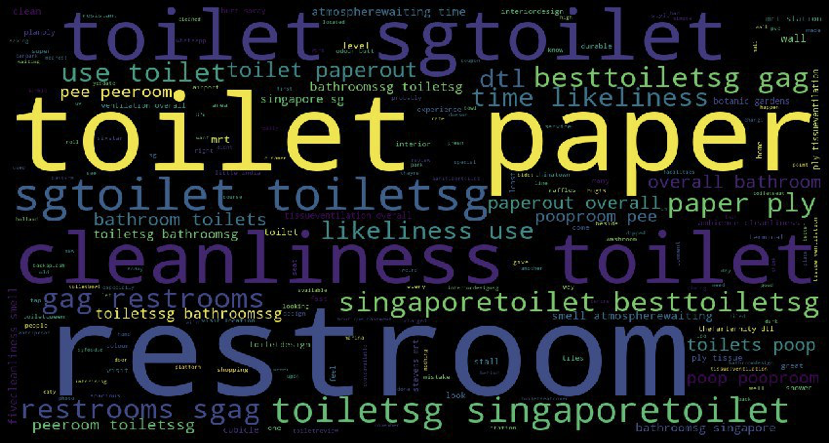
The WordMap generated help us identified some sample hashtags such as “#toiletsg”, “#sgtoilet”, “#singaporetoilet” , “#besttoiletsg” that we can look at to discover more post about public toilets in Singapore. However, there were also some interesting insights

We further filtered out common and words with little value and generated a new WordMap. The newly generated WordMap provided us with some insightful words which could mean a lot for the Restroom Assocation.
Some of these words we found could help to improve the coverage of evaluation criterias by Restroom Association since they are not present in the current evaluation sheet :
- ply tissue : This phrase sounds like the number of ply of tissues could affect the experience for the user.
- butt spray : Although this may seem crude, it actually mean that having a bidet could improve the experience for the user.
- backsplash: Another word that was mentioned that was interesting is backsplash, seems like if something could be done about this phenomenom it would enhance the user’s experience for public toilet.
The insights we gathered from Twitter for the WordMap was drastically different with more emphasis on crimes such as peeping tom and obscene acts.
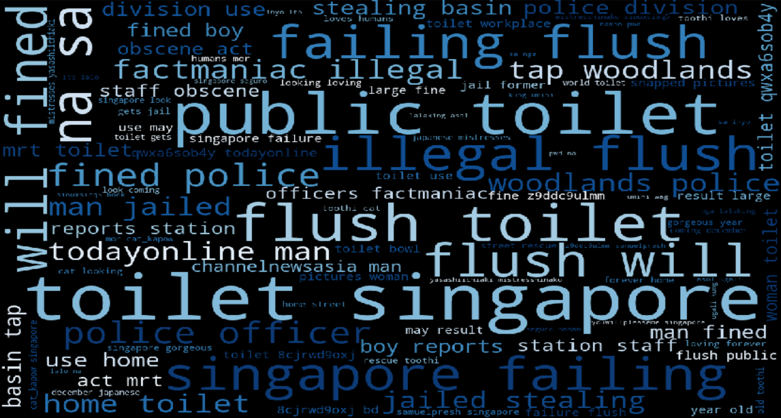
However, this was not the direction we were looking in and realized that Twitter was more useful for identifying crimes/news articles which happened in public toilets.
Topic Modeling
We generated 20 topics with Topic Modeling on the Reddit’s data and discovered that Topic 3 was closely related to the public opinion regarding public’s toilet.
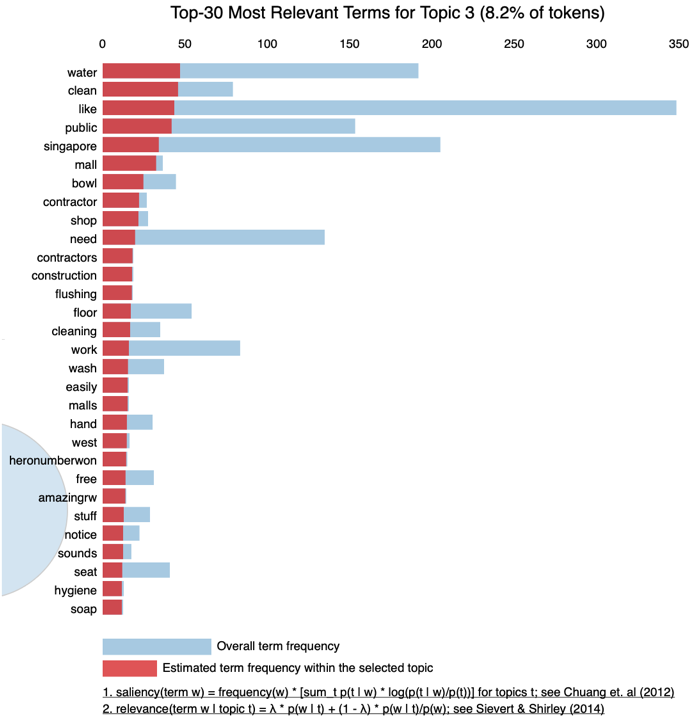
From the topics we generated, we look into various post which has the keyword mentioned and found some really interesting insights.
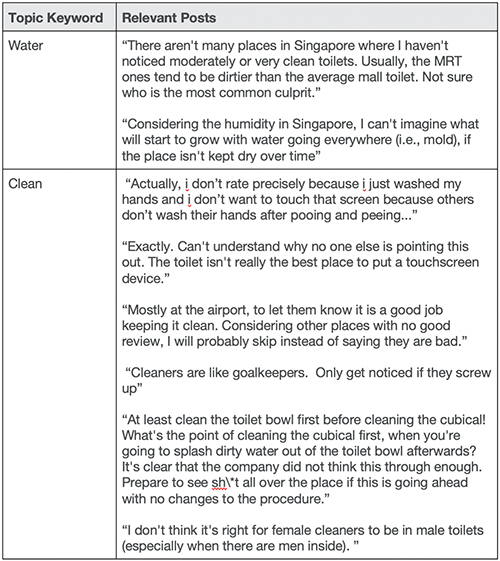
One of the more interesting insight was sentiments from public about the present of rating tablets in toilet. It seems like many people have chose not to provide a rating or feedback for each toilets due to doubts in clealiness of the tablets. This could be highlighted to toilets that having a rating tablet outside of the toilet can result in a more participated feedback system.
Recommendations
With the various analysis and insights we found, some of the recommendations that we provided were:
-
Enhancing the Toilet Assessment Criteria We found that having a bidet and the ply of tissues contributed to the overall experience of using a public toilet. These criterias were not found in the assesment criteria and as such we feedbacked about these criterias as possible addition.
-
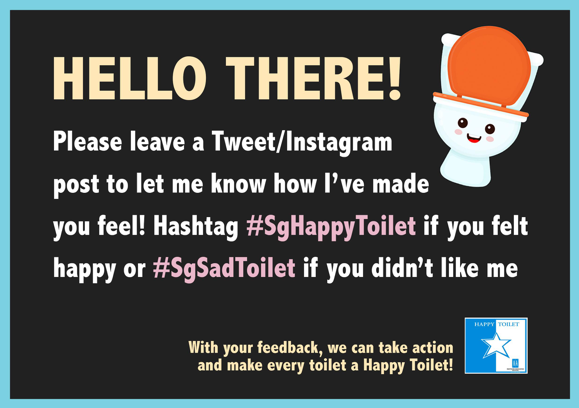
Social Media Campaign We found that having a campaign with designated hashtag would be helpful for further tracking and isolation of dirty toilets. These campaigns can encourage social media users to report about dirty or even clean toilets to contribute in the rating consideration for various toilets.
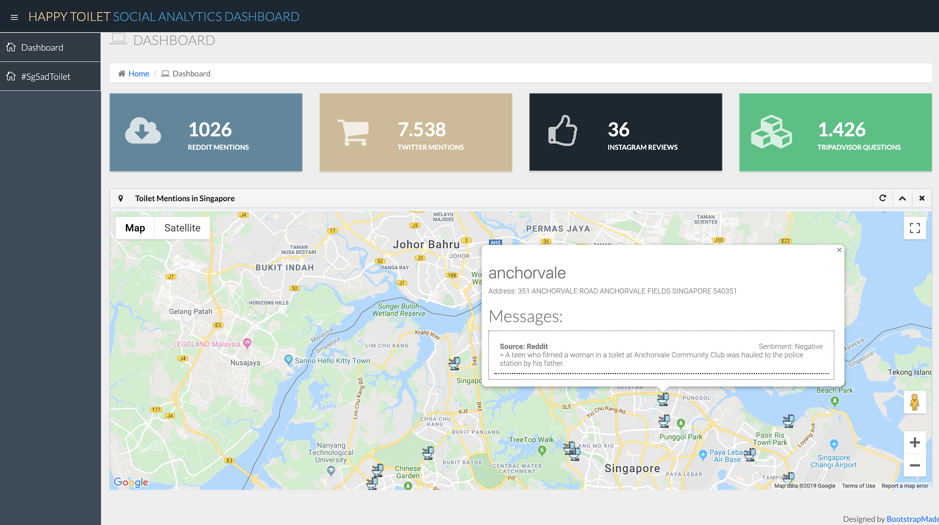
Flask Web App Prototype
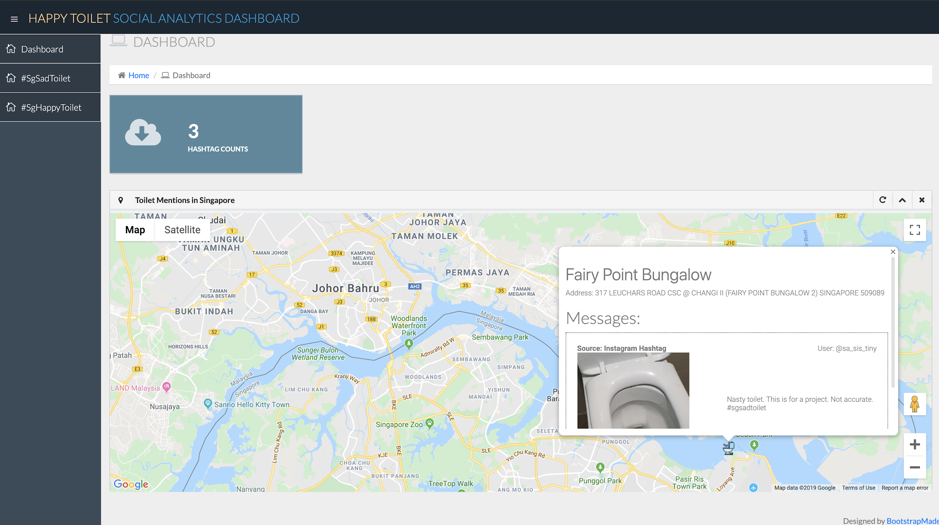
As part of the Social Analytics project, we also developed a Flask App prototype to imagine how a dashboard for tracking of toilet sentiments. We also did a “mockup” experiment to visualize how running the Social Media campaign might look like when tracked on the Flask App.
This show how it might look like if the social media campaign encourage the #sgdirtytoilet hashtag to be used on instagram
Credits
Prof Kyong Jin Shim - For the guidance and consultations provided.
Winston, Lijin, Ragini, Xiao Hang who worked really hard together for this project!